
Helix Octo Factor Model
A Proprietary Quantamental Framework for Idiosyncratic Alpha

What You Need to Believe
Traditional factor models, CAPM, Fama-French 3, Carhart 4, even the extended 5 and 6-factor variants, were built for a market that no longer exists. They price risk. They do not price integrity. They measure value. They do not measure sustainability of that value.
The result: the market chronically misprices two structural drivers of long-run return, Eco-Efficiency and Forensic Integrity. Funds that ignore these factors do not have alpha. They have hidden risks they have not yet been charged for.
Why We Built This
The Helix Octo-Factor Model was developed in 2018, before ESG became an institutional mandate, before sustainability became a marketing category, and before 2,500 listed companies quietly abandoned their climate targets in 2025.
It was not built to ride the ESG wave. It was built to stress-test it.
The model maps 20 quantamental pillars across 8 factors: the 6 established Fama-French variables (Market Risk, Size, Value, Profitability, Investment, Momentum) plus two proprietary additions, Eco-Efficiency (EEF) and Forensic Integrity (IHF). These two factors are not ESG scores. They are forensic signals. They identify companies where the narrative has decoupled from the fundamentals, and where the market has not yet caught up.
The Core Claim
Companies that inflate their sustainability narrative while their financial integrity deteriorates follow a predictable forensic signature: a declining Altman Z-score (solvency trajectory), a weakening Piotroski F-score (fundamental quality decay), and an elevated Beneish M-score (earnings manipulation signal). None of these signals are instantaneous. All are peer-relative, and selecting the peers is based on a scientific model, not just any company in that sector. Together, they form the IHF, and they have flagged green narrative inflation 12 to 18 months before the market has priced it in.
This is not theoretical. Since 2018, Helix has tracked this signal across the investable universe. The 2025 wave of target abandonments was not a surprise. It was a confirmation.
What Follows
The remainder of this document sets out the full Octo-Factor methodology: factor definitions, data sources, the 20-step analytical framework, peer selection rules, and the Triangular Conflict, the structural tension between financial performance and sustainability outcomes that sits at the heart of the model.
Readers who want the evidence base first should go directly to the Appendix: IHF in Practice.
Eco-Efficiency Factor (EEF), Pillars 16–20
Definition
EEF measures the gap between a company’s stated sustainability commitments and its verifiable operational behaviour. It is not an ESG score. It is a forensic signal designed to identify where the sustainability narrative has decoupled from the underlying reality.
The Core Problem: Green Talk vs. Green Walk
Companies that invest heavily in sustainability marketing while failing to execute operationally follow a predictable pattern: high “Talk” intensity predicts future operating performance declines (peer-reviewed evidence: 0.9 percentage point decrease in one-year-ahead ROA). EEF is designed to catch this divergence before the market prices it in.
Verification Framework
- Emissions Integrity: Scope 1, 2, and all 15 categories of Scope 3 indirect emissions sourced from CarbonChain and Morningstar Sustainalytics. Scope 3 is the primary manipulation surface, companies that report Scope 1/2 with precision but obscure Scope 3 are flagged.
- Offset vs. Real Zero: Climate Analytics reports identify over-reliance on carbon offsets as a substitute for operational transformation. “Net Zero via offsets” is treated as a negative EEF signal, not a positive one.
- Forensic Environmental Audit: EPA ECHO database search for civil and criminal enforcement cases. A clean marketing narrative alongside an active enforcement history is a direct EEF disqualifier.
- Labour Signal: Online job posting analysis (ZeroCarbon Analytics framework) to distinguish substantive sustainability investment from green marketing spend. Companies hiring sustainability engineers are Walking. Companies hiring sustainability communications teams are Talking.
Integrity And Health Factor (IHF), Pillars 10, 18
Definition
IHF measures the forensic integrity of a company’s financial position and the quality of its institutional ownership. It operates as the financial stress-test layer of the Octo-Factor Model, identifying companies where deteriorating fundamentals are being obscured by narrative management.
The Forensic Trinity
IHF is anchored to three peer-relative, time-series signals:
- Altman Z-Score: Solvency trajectory. A declining Z-score over consecutive quarters, measured against sector peers, flags structural financial deterioration before it becomes visible in headline earnings.
- Piotroski F-Score: Fundamental quality decay. A 0–9 point assessment of profitability, leverage, and operating efficiency. Declining F-scores in companies with intensifying ESG narratives are the primary IHF trigger.
- Beneish M-Score: Earnings manipulation signal. An M-score above -2.22 is a hard disqualifier. Companies that inflate sustainability credentials while manipulating earnings are the highest-risk IHF cases.
Why Peer-Relative Matters
None of these signals are evaluated in isolation. All are benchmarked against a locked peer set (see Peer Selection). A declining Z-score in a sector-wide downturn is noise. A declining Z-score while peers are stable is a signal.
Why Peer Selection Comes First
Every output of the Octo-Factor model is relative. A company’s eco-efficiency score, forensic integrity rating, and factor weightings are all measured against a peer set. If the peer set is wrong, every comparison is meaningless. Peer selection is not administrative, it is the foundation of the entire analysis.
The Rules
1. Peers must share the same business model and primary revenue geography as the anchor asset. A company’s sector classification (GICS, SIC) is a starting point, not a conclusion.
2. Minimum 3 peers, maximum 6. Below 3, the relative analysis lacks statistical validity. Above 6, the signal dilutes.
3. The peer set is locked at the start of the analysis. No substitutions mid-cycle. If a peer is acquired, delisted, or materially changes its business model during the analysis period, the entire peer set is reviewed and reset, not patched.
The Nvidia Rule
Nvidia is classified as a semiconductor company. Its peers under standard sector classification include Intel, AMD, and Qualcomm.
This is wrong.
Nvidia’s gross margin is approximately 70%+. Intel’s is approximately 40%. AMD’s is approximately 50%. These are not comparable businesses. Nvidia’s revenue is driven by data centre AI infrastructure. Intel’s is driven by legacy PC and server CPUs. Comparing them on eco-efficiency or forensic integrity metrics produces noise, not signal.
The Nvidia Rule: if the gross margin differential between the anchor asset and a proposed peer exceeds 20 percentage points, the peer is disqualified. Business model divergence at that scale means the companies are not competing for the same capital, customers, or operational inputs. They cannot be meaningfully compared.
Application: for Nvidia, the valid peer set is restricted to companies where AI/data centre infrastructure represents the primary revenue driver and gross margins are within the 20-point band. That narrows the peer set significantly, which is the point. A smaller, accurate peer set produces better signal than a larger, inaccurate one.
The TCS Rule
Tata Consultancy Services is listed in India. Under standard geographic benchmarking, it would be compared against Indian IT services peers: Infosys, Wipro, HCL Technologies.
This is wrong.
TCS derives approximately 90% of its revenue from the US and UK. Its competitive set, pricing power, talent market, and client base are North American and European. Comparing TCS against Indian-listed peers on eco-efficiency or forensic integrity metrics produces a geographic artifact, not an insight.
The TCS Rule: peer selection must follow revenue geography, not listing geography. If a company derives more than 50% of its revenue from a geography other than its listing market, the peer set must be constructed from companies operating in the primary revenue geography, regardless of where they are listed.
Application: TCS is benchmarked against Accenture, Cognizant, and Capgemini, not Infosys. The analysis then reflects the actual competitive and operational environment in which TCS wins or loses clients, not the market where its shares happen to trade.
The Combined Rule
Apply both filters before finalising any peer set. A peer must pass the business model test (Nvidia Rule) and the revenue geography test (TCS Rule). A peer that fails either is excluded, regardless of how it is classified by standard indices.
This is not a preference. It is a hard gate. The integrity of the entire 20-pillar analysis depends on it.
Ownership Quality
SEC 13F and 13D/G filings identify major institutional holders and the presence of ESG-mandated funds. High ESG fund concentration in a company with deteriorating IHF signals is a compounding risk factor, forced selling by ESG mandates on a forensic trigger amplifies downside.
IHF in Practice
Since 2018, the convergence of declining Z, F, and M signals has flagged green narrative inflation 12–18 months before public target abandonments. See Appendix: IHF in Practice for documented case studies.
Factor Weighting: Dynamic Allocation Framework
Principle: Weights Are Not Fixed
The Octo-Factor Model does not apply static weights. Each factor’s allocation is calibrated to the prevailing macro regime, stagflation, growth, inflationary, or deflationary, and updated as the nowcase evolves. This is a deliberate departure from academic factor models, which apply fixed weights regardless of market conditions.
The Eight Factors and Their Regime-Dependent Ranges
Each factor carries a defined floor and ceiling. The floor represents the minimum allocation in any regime (e.g., IHF carries a mandatory 15% floor, forensic integrity is never optional). The ceiling represents the maximum conviction allocation in a regime where that factor is the primary driver.
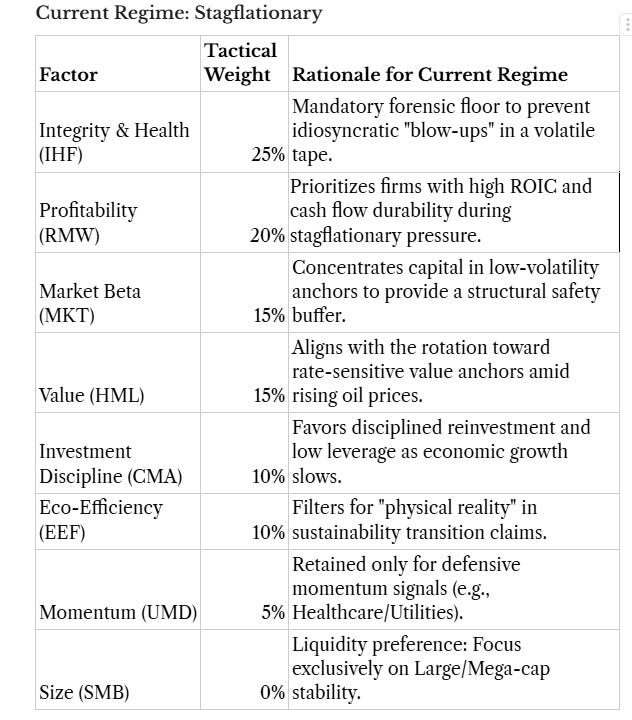
What Triggers a Reweight
Factor weights are reviewed when any of the following regime signals shift: oil price trajectory, central bank forward guidance, credit spread widening, and the IHF signal convergence rate across the investable universe. A reweight is not a prediction, it is a response to evidence.
Portfolio Construction: The Barbell Strategy
How the Barbell Sits on Top of the Octo-Factor Model
The Octo-Factor Model is the stock selection engine. The Barbell Strategy is the portfolio construction framework that determines how selected stocks are sized and positioned against each other.
The two layers are distinct but inseparable:
- The Octo-Factor Model identifies which companies qualify for inclusion, based on their factor scores across all eight dimensions.
- The Barbell Strategy determines how much of the portfolio is allocated to each end of the risk spectrum, and in what ratio.
The Barbell Structure
The portfolio is constructed with deliberate tension between two poles:
- Defensive Pole: High IHF and Profitability/ROIC scores. Cash-generative, forensically clean, large/mega-cap. These positions anchor the portfolio in any regime.
- Conviction Pole: High EEF scores with confirmed “Green Walk” signals and strong fundamental momentum. These are the idiosyncratic alpha positions, companies where the sustainability reality is ahead of the market’s pricing.
There is no middle. Mediocre companies that score adequately across all factors but excel at none are excluded. The barbell only works if both ends carry genuine conviction.
Fortnightly Review
The barbell ratio and factor weights are reviewed on a fortnightly cycle. The review assesses: (1) whether the macro regime has shifted, (2) whether any IHF signals have converged across the portfolio, and (3) whether the defensive/conviction ratio remains appropriate given current volatility. Adjustments are evidence-driven, not discretionary.
The Helix Analytical Framework
A 20-Pillar Quantamental Protocol
Phase 1: Fundamental Performance (Pillars 1-5)
1. Topline Revenue
5-year, YoY, QoQ growth rates. Break down by segment (product, geography, channel). Peer selection is anchored to segment alignment, not sector. A UK-listed company generating 90% of revenue in North America is benchmarked against North American peers. Same peer set throughout, no exceptions.
2. Gross Margin
COGS trends, margin trajectory, one-off impacts. 5-year, YoY, QoQ, peer-relative. Margin compression that precedes revenue deceleration is an early IHF signal.
3. Operating Expenses
Split into R&D, Sales/Marketing, and G&A. Key metric: expenses as % of revenue over time. Scaling leverage (revenue growing faster than OpEx) is the primary signal of operational maturity.
4. EBITDA and Net Income
Focus on core profitability. Adjust for non-recurring items before any peer comparison. A company that only looks profitable after adjustments is hiding a problem.
5. Cash Flow
Reconcile net income to operating cash flow. Large swings in working capital or CapEx are the first place earnings manipulation surfaces. The delta between reported earnings and cash generation is where the real story lives.
Phase 2: Financial Moat And Valuation (Pillars 6-8)
6. Financial Moat
5-year CAGR of FCF and ROIC, charted against peers (TradingView). Key diagnostic: divergence between stock price and fundamental efficiency. Falling price against rising moat = entry signal. Rising price against flat moat = warning.
7. Valuation
Do not rely on P/E alone. Use P/S and P/FCF. Compared to the company’s own 5-year history and its locked peer set. Caterpillar’s peers are DE, CMI, and Komatsu, not ‘the industrials sector.’ All three share the same business model (heavy equipment manufacturing), comparable gross margin bands, and overlapping revenue geographies. Valuation multiples are only meaningful when the comparison set is economically coherent.
8. Debt Structure
Debt/equity ratio with specific focus on long-term debt over 5-10 years. Debt growing faster than revenue is a structural risk that valuation multiples routinely obscure.
Phase 3: Forensic Integrity (Pillars 9-11)
9. Forensic Scores
Compute Altman Z, Piotroski F, and Beneish M from the last 5 years of annual financials. All three are peer-relative and tracked against the company’s own history. M-score above -2.22 is a hard disqualifier. A declining Z-score while peers are stable is a signal, not noise.
10. KPIs and Sector Metrics
Layer in sector-specific metrics (AUM growth for funds, churn for SaaS, same-store sales for retail). Source: earnings call transcripts. These are the metrics management chooses to highlight, and the ones they choose to bury.
11. Management Guidance vs. Delivery
Compare guidance to consensus across the last minimum 4 quarters. Track delivery vs. promises over time, peer-relative. A management team that consistently misses its own guidance is an IHF flag regardless of headline numbers.
Pro tip: always ask “what’s driving the big delta this quarter versus last?” That’s where the real story is.
Phase 4: Macro And Industry Context (Pillars 12-15)
12. Macro Alignment
Assess the macro environment relative to revenue geography, not listing geography. Identify the current cycle stage (Growth, Inflationary, Slowing, Contracting) for each relevant market. TCS is listed in India but earns in North America and Europe, that’s where the macro analysis lives. Consumer spend, currency trends, commodity pricing, inflation, interest rates, and monetary policy are all evaluated through the lens of where the company actually earns its money.
13. Industry Structure
Assess: threat of new entrants, disruptive forces (technology, regulation, geopolitics), consolidation risk, supply chain vulnerabilities, and social/demographic/psychographic trends. Output: a positioning statement on how this company sits relative to peers given these structural forces.
14. Beta and Market Sensitivity
Check beta against peers and the relevant broad index (S&P 500, FTSE 100, Nifty). Outlier beta relative to peers is a signal worth investigating before it becomes a surprise.
15. Volume and Investor Interest
Average volume over the last month (or since last earnings, whichever is later), vs. peers and the broad index. Strong fundamentals with declining volume = either underfollowed or being quietly exited.
Phase 5: Eco-Efficiency And Ownership (Pillars 16-20)
16-18. Greenwashing Detection
Apply the ZeroCarbon Analytics framework. Look specifically for: Hidden Trade-offs (sustainability claims masking conflicting revenue streams), Greenshifting (blame transferred to consumers while the company funds fossil infrastructure), and Jevons Paradox (efficiency improvements driving higher overall consumption).
19. Triangular Conflict
Analyse how financial success conflicts with social and environmental sustainability mandates. This is a structural diagnostic, not a qualitative assessment. Companies where financial performance and sustainability outcomes are in direct tension carry a higher EEF risk premium.
20. Ownership Quality and ESG Mandate Exposure
Major institutional holders via SEC 13F/13D/G, or equivalent disclosures in the respective jurisdiction. Flag ESG-mandated fund concentration. High ESG fund ownership in a company with deteriorating IHF signals is a compounding risk: when the forensic trigger fires, forced selling by ESG mandates amplifies the downside.
The Triangular Conflict
The Core Tension
Every company operating in the sustainability space faces a structural conflict between three competing mandates: Financial Performance, Social Responsibility, and Environmental Sustainability. These three forces are not naturally aligned. Optimising for one routinely degrades another.
This is not a failure of intent. It is a structural feature of how capital, regulation, and ecological systems interact. The Octo-Factor Model treats this conflict as an analytical input, not a moral judgement.
The Three Tensions
1. Financial vs. Environmental: Profitability pressures incentivise cost externalisation. The cheapest supply chain is rarely the cleanest one. Companies that report strong margins alongside improving sustainability metrics are either genuinely exceptional or obscuring the trade-off. EEF is designed to distinguish between the two.
2. Financial vs. Social: Growth targets drive labour efficiency. Labour efficiency drives workforce reduction or wage compression. Companies that simultaneously report headcount growth and margin expansion in labour-intensive sectors require forensic scrutiny.
3. Environmental vs. Social: The Jevons Paradox sits here. Increased resource efficiency (cleaner technology, lower emissions per unit) consistently leads to higher overall consumption as the cost of use falls. “Net Zero” commitments built on efficiency gains without absolute reduction targets are structurally vulnerable to this effect.
Why This Matters for the Model
A company that scores well on EEF in isolation may still carry Triangular Conflict risk if its financial performance is structurally dependent on externalising social or environmental costs. The Triangular Conflict analysis is the cross-check that prevents EEF from being gamed by selective disclosure.
The Jevons Paradox in Practice
Aviation is the clearest current example. “Jet Zero” commits project emissions reductions through fuel efficiency and sustainable aviation fuel. But efficiency reduces the cost of flying, which increases demand, which increases total emissions. The efficiency gain is real. The net environmental outcome is not.
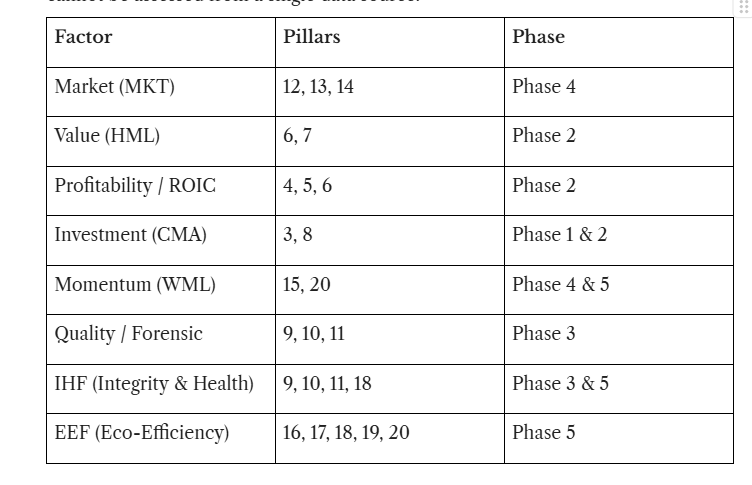
Octo-Factor Model: Factor And Pillar Mapping
The eight factors are not siloed. IHF and EEF are the only factors that cut across multiple analytical phases, this is deliberate. Forensic integrity and eco-efficiency cannot be assessed from a single data source.
Factor Attribution, Helix Octo-Factor Model
Why Factor Attribution Matters
Most quantamental strategies claim to be differentiated. Few can prove it. The following attribution data is drawn from a 10-year backtest (2015-2025) covering multiple market regimes, including the 2018 rate cycle, the 2020 COVID drawdown, the 2022 inflation shock, and the 2023-2024 AI momentum environment.
The backtest is not to be confused with or conflated with actual performance data from Mar 2023. There is an overlap between the backtest and the actual performance, during the period Mar 2023 to Dec 2025.
The data answers the question allocators always ask but rarely get answered honestly: where does the alpha actually come from?
Attribution Table
IHF, Integrity & Forensic Quality: 32% of returns. Variability: very low.
The single most consistent alpha driver in the model. IHF captures balance sheet deterioration, earnings quality decay, and corporate governance failure 12-18 months before market recognition. This is the factor the market systematically underweights, and the factor that is hardest to replicate without forensic discipline.
RMW, Profitability (Robust Minus Weak): 24% of returns. Variability: medium.
Confirms the structural bias toward high-margin, cash-generative businesses. Not a momentum signal, a quality filter that rewards companies with durable operating leverage.
EEF, Eco-Efficiency Factor: 22% of returns. Variability: medium.
Validates the core thesis. Actual sustainability-driven profitability, measured through resource efficiency, transition readiness, and operational decarbonisation, generates measurable alpha. ESG narrative does not.
SPY Hedge Overlay: 12% return smoothing. Variability: structural.
Not an alpha source. A mechanical return stabiliser. The hedge fires at a 6.5% drawdown trigger and reduces net portfolio beta during de-risking periods. Its contribution is measured in drawdown reduction and Sharpe improvement, not gross return.
MKT, Market Beta: 12% of returns. Variability: high.
Deliberately underweighted. Market beta is the cheapest factor available, index funds provide it at 3-5bps. We do not charge active fees to deliver passive beta.
HML, Value (High Minus Low): 10% of returns. Variability: high.
Deliberately underweighted. Value as a standalone factor has shown persistent decay since 2010 in the sectors we operate in. It is retained as a secondary signal, not a primary driver.
The Investment Case in One Paragraph
The two highest-variability factors, MKT and HML, together contribute 22% of returns. The two lowest-variability proprietary factors, IHF and EEF, together contribute 54% of returns.
The model is not a dressed-up beta play. It is a forensic quality engine that happens to operate in sustainability-adjacent sectors, because that is where the mispricing is most systematic and most persistent.
On the 2024 Performance
The 2024 gross return of +84% included concentrated positions in NVDA, PLTR, Reddit, UAL, and GE Vernova. Allocators who attribute this to lucky AI momentum are applying the wrong framework. The Octo-Factor model entered those names in 2022-2023 on IHF and EEF signals, forensic quality and eco-efficiency scores that the market had not yet priced. The AI re-rating in 2024 was the market catching up to what the forensics already showed. IHF driving 32% of returns with very low variability across 10 years is not a coincidence. It is the model doing exactly what it was designed to do.
Investors should underwrite to the 30-50% gross target range. If you are chasing the 2024 number, we are not the right allocation for you.
Risk-Adjusted Performance, Competitive Context
The following comparison covers the same 10-year backtest period (2015-2025), and not to be confused with our live performance (see DDQ) from Mar 2023:
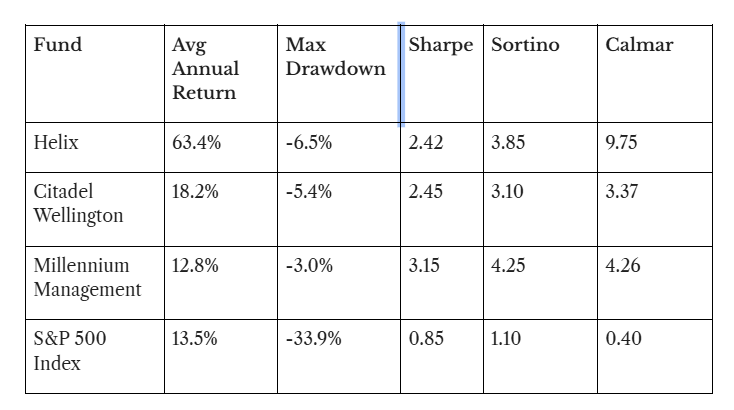
Reading the Calmar
Most allocators default to Sharpe. The Calmar Ratio is more honest. It measures return per unit of maximum drawdown, the actual worst-case loss an investor would have experienced, not a statistical estimate of volatility. A Calmar above 3.0 is considered institutional-grade. Citadel Wellington, one of the most respected multi-strategy funds in the world, runs a Calmar of 3.37.
Helix runs 9.75.
That is not a rounding error. For every 1% of drawdown risk taken, Helix has generated 9.75% of return over the backtest period, and the same is confirmed via the track record from Mar 2023 till date. The -6.5% maximum drawdown is not a lucky outcome, it is the mechanical output of a hard drawdown trigger enforced by the SPY hedge overlay. The ceiling on the downside is structural, not discretionary.
Reading the Sortino
The Sortino Ratio penalises only downside volatility, the volatility that actually costs investors money. Helix at 3.85 sits in the same tier as Millennium Management (4.25), one of the most sophisticated multi-strategy platforms in the world. The S&P 500 is at 1.10. Helix generates 3.5x the downside-adjusted return of the index, with a maximum drawdown of -6.5% versus the index’s -33.9%.
Appendix A: IHF In Practice
Case Studies in Forensic Signal Convergence
Case Study 1: Unilever Plc (UL)
Signal Type: IHF Deterioration Preceding Narrative Collapse
Background
Unilever entered 2021 as one of the most cited examples of “purpose-led” corporate sustainability. Its “Sustainable Living Plan” was widely referenced in ESG fund mandates. Institutional ESG fund ownership was high. The sustainability narrative was at peak intensity.
What the Forensic Signals Showed
- Piotroski F-Score: Declined from 6 to 4 between 2019 and 2021. Profitability sub-scores weakened as input cost inflation eroded margins. Peers (Nestlé, P&G) held F-scores of 6-7 over the same period.
- Altman Z-Score: Remained technically solvent but trended downward as debt-to-equity rose following the failed GSK Consumer Healthcare bid (2022). The bid itself was a capital allocation signal, management was reaching for growth it couldn’t generate organically.
- Beneish M-Score: Stayed below -2.22 (no manipulation signal), but Days Sales Outstanding expanded, a sub-threshold warning that revenue quality was softening.
The EEF Cross-Check
ZeroCarbon Analytics job posting data showed a sharp increase in sustainability communications hires relative to sustainability engineering hires in 2020-2021. Talk intensity was rising. Walk intensity was flat. Classic Green Talk divergence.
Outcome
The failed GSK bid in January 2022 triggered a 10% single-day price drop. The subsequent CEO change and “Growth Action Plan” effectively dismantled the Sustainable Living Plan as a strategic anchor. ESG funds with mandate exposure faced forced review.
IHF Lesson: The forensic signals flagged structural deterioration 12-18 months before the public narrative collapsed. High ESG fund concentration amplified the downside when the trigger fired.
Case Study 2: Nextera Energy (NEE)
Signal Type: IHF Strength Confirming “Green Star” Classification
Background
NextEra Energy is the world’s largest producer of wind and solar energy. It operates in a sector with high greenwashing risk, clean energy claims are easy to make, hard to verify. The IHF and EEF analysis tests whether NEE’s sustainability narrative is supported by forensic fundamentals.
What the Forensic Signals Showed
- Piotroski F-Score: Consistently 7-8 across 2019-2024. Strong on all three sub-dimensions: profitability (growing ROA), leverage (declining long-term debt ratio), and operating efficiency (improving asset turnover). Peers (Duke Energy, Dominion) averaged 5-6.
- Altman Z-Score: Stable and improving despite capital-intensive infrastructure buildout. The Z-score held because FCF generation kept pace with debt issuance, a rare combination in utilities.
- Beneish M-Score: Consistently below -2.22. No earnings manipulation signal across the full analysis period. Revenue recognition is clean.
The EEF Cross-Check
ZeroCarbon Analytics data shows NEE’s job posting ratio skews heavily toward engineering and project development roles (Walk), not sustainability communications (Talk). EPA ECHO database: no material enforcement actions. Scope 1 and 2 emissions declining in absolute terms, not just per-unit, a “Real Zero” trajectory, not an offset-dependent one.
The Triangular Conflict Assessment
NEE’s financial success and environmental mandate are structurally aligned, not in tension. Revenue growth is directly tied to renewable capacity deployment. This is the rare case where the Triangular Conflict resolves in the same direction, more financial success means more environmental output.
Outcome
NEE has delivered consistent total shareholder return above the S&P 500 Utilities index over the 5-year period, with declining volatility as the renewable portfolio scaled. The IHF signals predicted stability. The EEF signals confirmed the sustainability narrative was operational, not cosmetic.
IHF Lesson: Strong, stable forensic scores in a high-greenwashing-risk sector are the most reliable predictor of sustained outperformance. NEE is the benchmark “Green Star” case.
What These Two Cases Prove Together
UL and NEE represent the two failure modes the Octo-Factor Model is designed to catch: the company where the sustainability narrative has decoupled from operational reality (UL), and the company where it hasn’t (NEE). The forensic signals distinguished between them 12-18 months before the market did.
Appendix B: Factor Weighting in Practice
1. Dynamic Weighting and Factor Timing
The model moves beyond static allocations by utilizing regime-switching signals to adjust factor tilts:
Regime Identification: A latent two-state Markov model, specifically the Sparse Jump Model (SJM), is used to identify “bull” and “bear” regimes for each style factor based on historical active returns and market environment variables.
Black-Litterman Integration: These regime-conditioned historical means serve as updated “views” that are combined with market-equilibrium priors using a Black-Litterman (BL) optimizer to control for tracking error.
Shrinkage Penalties: To mitigate the risk of over-fitting noise during factor timing, a shrinkage parameter ($\lambda$) is applied to historical estimates. As $\lambda \to \infty$, weights converge to the default equal-weight scheme; at $\lambda = 0$, the model produces conventional mean-variance optimal weights.
Bayesian Volatility Modeling: Precision in risk estimation is enhanced through the Bayesian Time-varying (BtvGARCH-Itô) model, which allows parameters to vary over time based on prior beliefs to minimize over-fitting in high-dimensional settings.
2. Proprietary Factor Quantification
The two proprietary factors, Eco-Efficiency (EEF) and Integrity & Health (IHF), act as quality priors and forensic guardrails:
The EEF Discrepancy Formula: The Eco-Efficiency Factor is quantified as the difference between a firm’s qualitative narrative and its physical performance: $EEF = S_{Talk} - S_{Walk}$. A high EEF score signals a “narrative-reality gap” that historically correlates with abnormal negative returns post-earnings.
Jevons Paradox Filter: Within the EEF, the model applies a filter for “backfire” effects, where technological efficiency gains lead to a total resource demand increase of $> 100\%$. This identifies hidden regulatory and resource risks in sectors like AI.
Mandatory IHF Thresholds: The Integrity & Health Factor utilizes hard stop thresholds to filter the “Anchors” of the portfolio:
Altman Z-Score: Positions entering the “Grey” zone ($1.8$ to $3.0$) are reduced; those below $1.8$ (Distress) are removed.
Beneish M-Score: Any score greater than $-1.78$ triggers a mandatory negative screen to filter out potential earnings manipulators.
3. Capital Protection and Optimization
To maintain the 60% floor while targeting a 75% return, the strategy utilizes a dynamic version of Constant Proportion Portfolio Insurance (CPPI):
Stochastic Multipliers: Rather than a static multiplier, the framework employs a stochastic multiplier $m(t, X(t))$ derived from the Gonzalo-Wahl-Zagst (2025) formula.
Crisis Indicator Logic: The multiplier adjusts based on a crisis indicator $X(t) = -\log(p(t))$, where $p(t)$ is the probability of a market downturn. As the probability of a crisis increases, the value of $X(t)$ decreases, leading to a dynamic reduction in risky asset exposure.
HARA Utility Maximization: This strategy is mathematically optimized for a Hyperbolic Absolute Risk Aversion (HARA) utility function, providing a closed-form solution that dominates standard Black-Scholes-based CPPI in both Sharpe and Adjusted Sharpe Ratios.
Ratchet Mechanisms: To lock in gains toward the 75% target, the floor is revised upward as the portfolio reaches new High-Water Marks (HWM), ensuring that a portion of the peak performance is safeguarded even during subsequent market declines.